My Name is Crispin BAGANDA
I create processes that transform data into actionable insights then present keys findingds in Dashboard that helps stakeholders make informed decisions.
Here you will find projects that shows how I use data to help businesses and organisations make informed decisions. Technology at your service.
I create processes that transform data into actionable insights then present keys findingds in Dashboard that helps stakeholders make informed decisions.
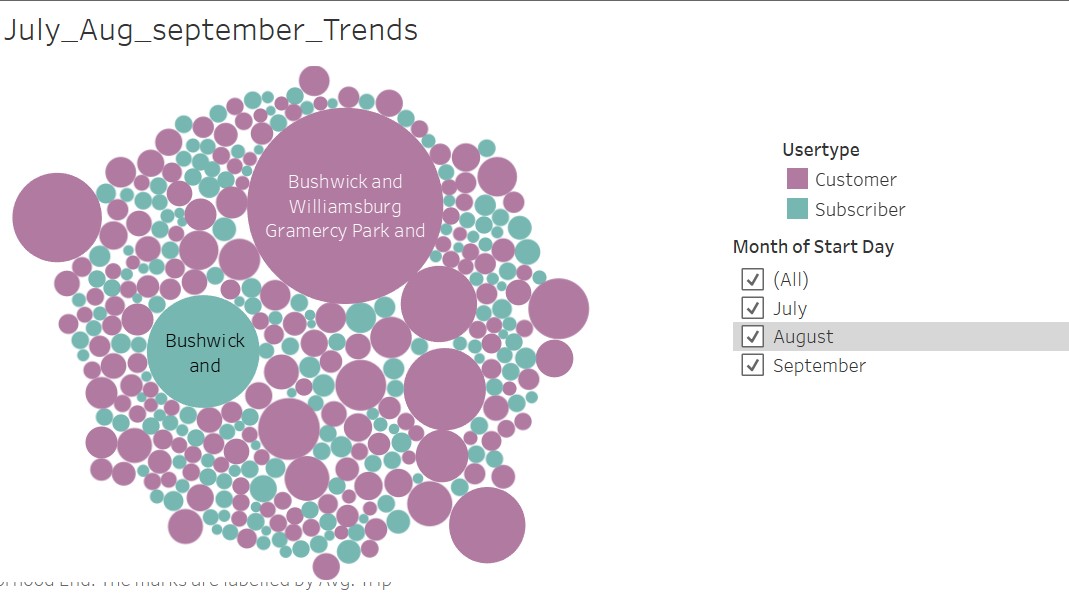
Neighborhood Station End andNeighborhood station Start. Colour shows details about Usertype, (1 time customers vs Subscriber). Size shows average of Trip Minutes. The marks are labelled by Neighborhood End andNeighborhood Start.The data is filtered on Start Day Month, which keeps July,AugustandSeptember. Each pie represent a station in New york district.
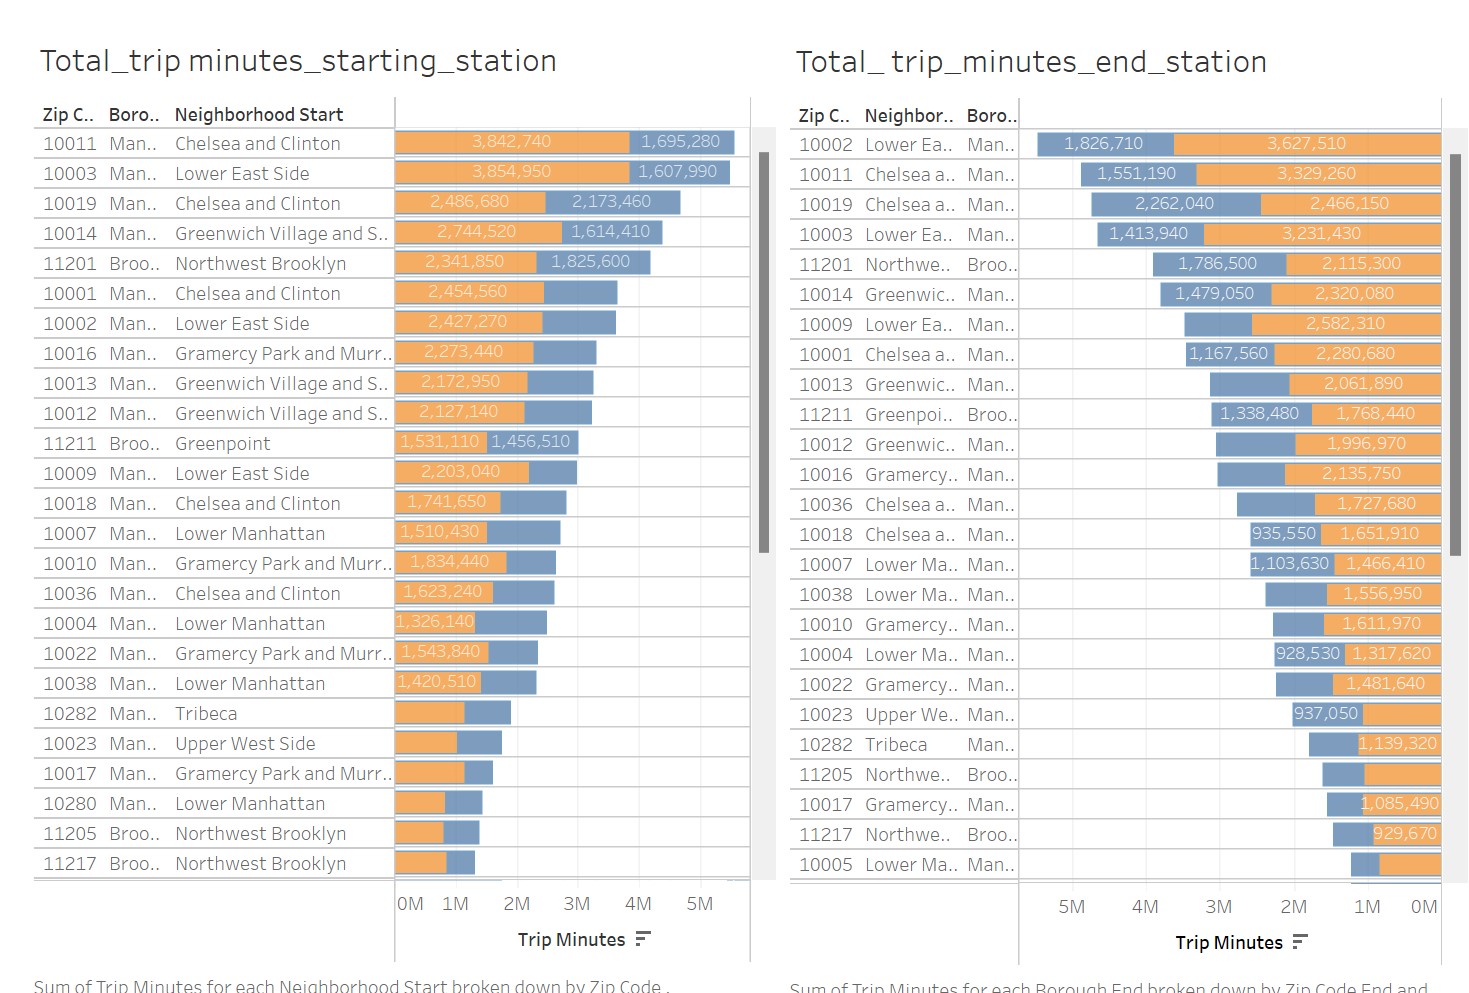
Sum of Trip Minutes for each Neighborhood Start on the left broken down by Zip Code , neighboorhood Start and Borough Start As well as Neighborhood destination on the right. Colour shows details about Usertype( 1times customer vs subscriber ) . The marks are labelled by sum of Trip Minutes.
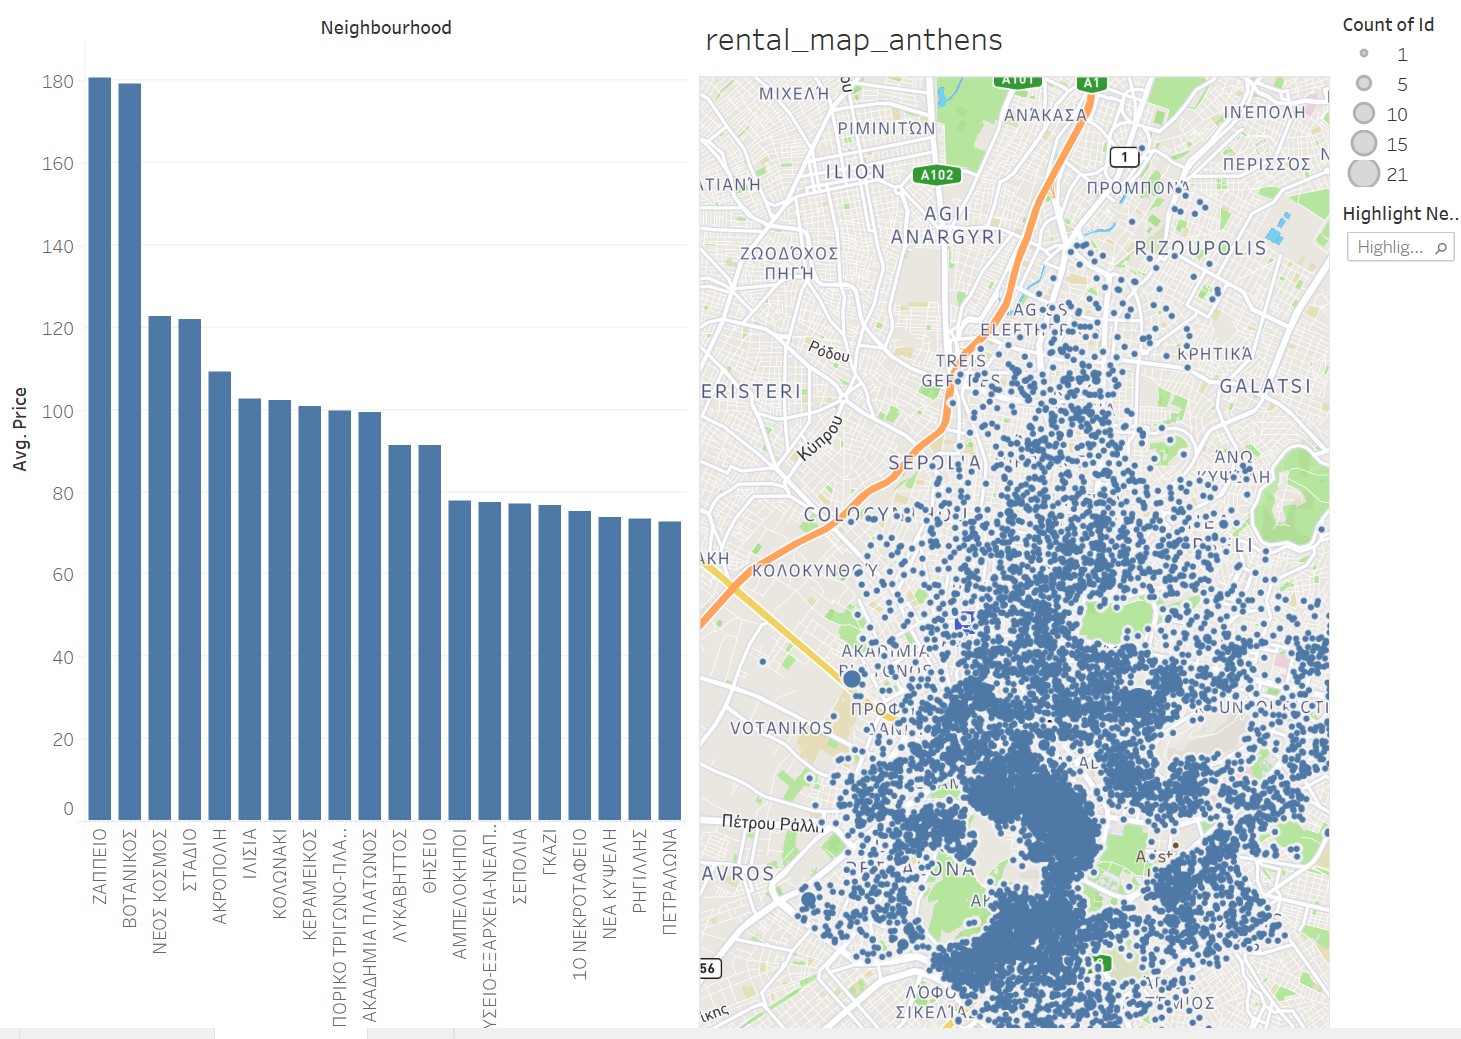
Average of Price for each Neighbourhood.The data is filtered on Action (Latitude,Longitude), which keeps 8,995 members.The view is filtered on Neighbourhood, which excludes ΑΓΙΟΣ ΕΛΕΥΘΕΡΙΟΣandΚΟΥΚΑΚΙ-ΜΑΚΡΥΓΙΑΝΝΗ.
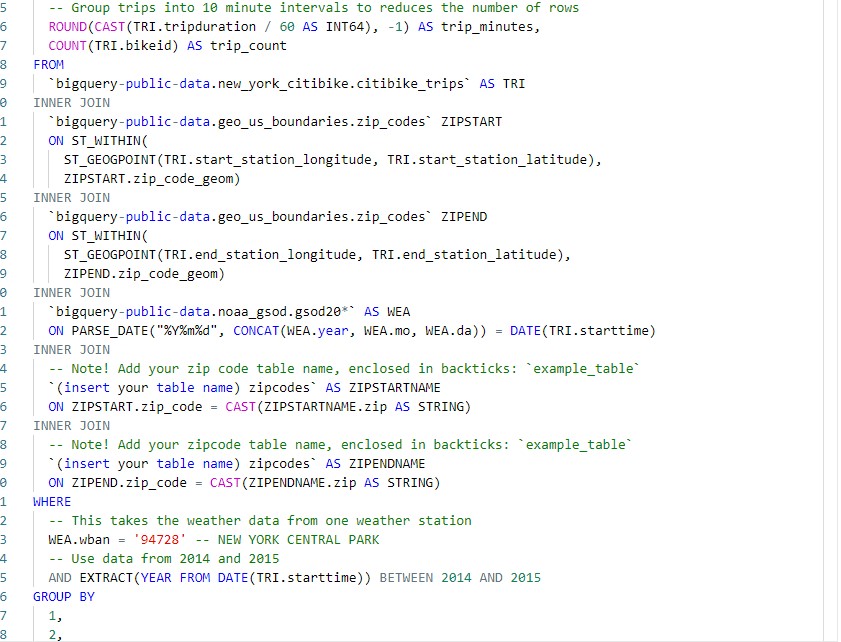
Here I prepare a pipeline process that will deliver data into a target table which I will evantually use to make dashboard. Original data is fetched from public data set .
2 Langsdale Terrace
Leeds, United Kingdom